What are good readings on a heart monitor?
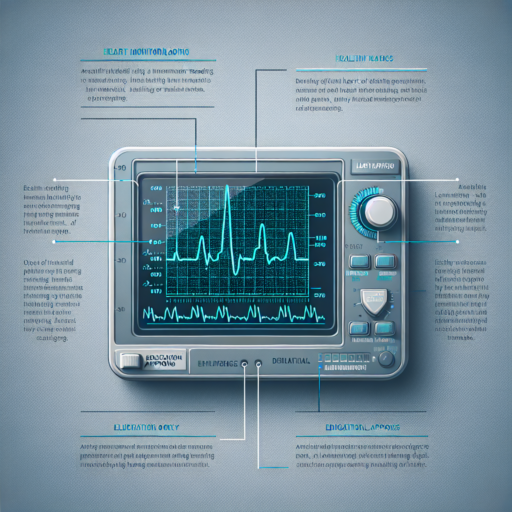
Understanding what good readings on a heart monitor look like is crucial for interpreting the health and well-being of an individual’s cardiovascular system. Generally, heart monitors, including those found on fitness trackers and medical devices, provide critical data about heart rate, rhythm, and sometimes even heart rate variability (HRV).
Normal Heart Rate Range
A good reading for a resting heart rate typically falls within the range of 60 to 100 beats per minute (BPM) for adults. However, athletes or individuals with high levels of physical fitness may have resting heart rates below this range, which can also be considered normal for their specific health conditions.
Understanding Heart Rhythm
Apart from the heart rate, the rhythm depicted on a heart monitor is a critical aspect to consider. A regular, consistent heart rhythm is a sign of a healthy heart. Any irregularities, such as skipped beats or an erratic pattern, could indicate underlying issues that might require medical attention. It’s important for individuals to recognize what a normal rhythm looks like on their devices to discern any potential anomalies promptly.
Significance of Heart Rate Variability (HRV)
Heart rate variability, which measures the variation in time between each heartbeat, is another vital piece of information a heart monitor can provide. A higher HRV indicates more variability between heartbeats, which is typically a sign of a healthy and responsive cardiovascular system. Conversely, lower HRV can suggest stress, fatigue, or underlying health concerns. Tracking HRV can offer insights into your overall heart health and even signal the need for lifestyle changes or medical consultation.
By understanding these key elements, individuals can better interpret the data from their heart monitors, leading to informed decisions about their health and fitness routines.
No se han encontrado productos.
How to read heart rate monitor results?
Understanding the Basics
Reading heart rate monitor results begins with understanding what the numbers mean. A heart rate monitor displays your heart rate in beats per minute (BPM). A normal resting heart rate for adults ranges from 60 to 100 BPM. However, it’s essential to recognize that optimal heart rates can vary based on age, fitness level, and overall health. Knowing your average resting heart rate can help you identify deviations indicative of stress, overtraining, or potential health issues.
Interpreting Your Heart Rate Zones
Heart rate monitors often categorize your heart rate into different zones. These zones are based on percentages of your maximum heart rate (the fastest your heart can beat) and can guide you in understanding the intensity of your workouts. For instance, the fat-burning zone is typically 50% to 70% of your maximum heart rate, while the aerobic or cardio zone ranges from 70% to 85% of your maximum. Reading which zone your current heart rate falls into can help tailor your workouts to better meet your fitness goals.
Analyzing Variability and Trends
A crucial aspect of reading heart rate monitor results is analyzing the variability and trends over time. Noticeable patterns, such as an increasing resting heart rate over several days, can signal overtraining or a need for rest. Conversely, a downward trend in your resting heart rate could indicate improving cardiovascular fitness. Additionally, observing how quickly your heart rate returns to normal after exercise can provide insights into your heart’s health and endurance levels. Key to this analysis is consistency in monitoring and comparing results under similar conditions and times of the day.
What are normal numbers on a heart monitor?
Understanding the numbers flashing on a heart monitor can be puzzling for many. Generally, these numbers represent your heart rate or pulse, indicating how many times your heart beats per minute. For most adults, a normal heart rate falls between 60 and 100 beats per minute (bpm) when at rest. However, factors such as age, fitness level, and medication can influence this range.
Factors Affecting Heart Rate
Several factors can affect what is considered a normal reading on your heart monitor. For instance, athletes often have a lower resting heart rate due to their higher level of fitness. Similarly, medication tailored to manage blood pressure can also lower heart rate. It’s important to understand your personal baseline and discuss what is normal for you with your healthcare provider.
When to Seek Medical Advice
While a heart rate within the 60-100 bpm range is considered normal for most, sudden changes or personal feelings of distress should not be ignored. If your heart monitor is consistently showing a heart rate below 60 bpm (bradycardia) or above 100 bpm (tachycardia) while at rest, and you experience symptoms such as dizziness, fatigue, or shortness of breath, it’s prudent to seek medical advice.
What is a normal ECG value on a monitor?
Understanding normal ECG values on a monitor is crucial for anyone keeping an eye on their heart health. An Electrocardiogram (ECG) is a simple test that records the heart’s electrical activity. Normal values are essential for discerning the heart’s condition and identifying any potential issues early on. Typically, these values are represented through various components on the ECG monitor, which include the P wave, QRS complex, and T wave, each reflecting different aspects of the heart’s electrical activity.
A normal P wave corresponds to the initial wave seen on an ECG and indicates atrial depolarization. A standard P wave has a maximum height of 2.5 mm and a maximum duration of 0.11 seconds. Following the P wave is the QRS complex, representing ventricular depolarization. For a normal QRS complex, the duration should not exceed 0.10 seconds, ensuring the heart’s ventricles are not taking too long to contract. Lastly, the T wave, which should be upright in most leads, signifies ventricular repolarization. It’s crucial that these waves follow a regular rhythm and pattern to confirm a healthy heart function.
In conclusion, while analyzing an ECG, healthcare professionals look for these values to fall within specific ranges. A normal ECG on a monitor typically presents a heart rate between 60 to 100 beats per minute, a PR interval spanning from 0.12 to 0.20 seconds, and a QT interval adjusted for heart rate (QTc) less than 0.44 seconds. Recognizing these values aids in detecting any anomalies that could indicate underlying heart conditions.


